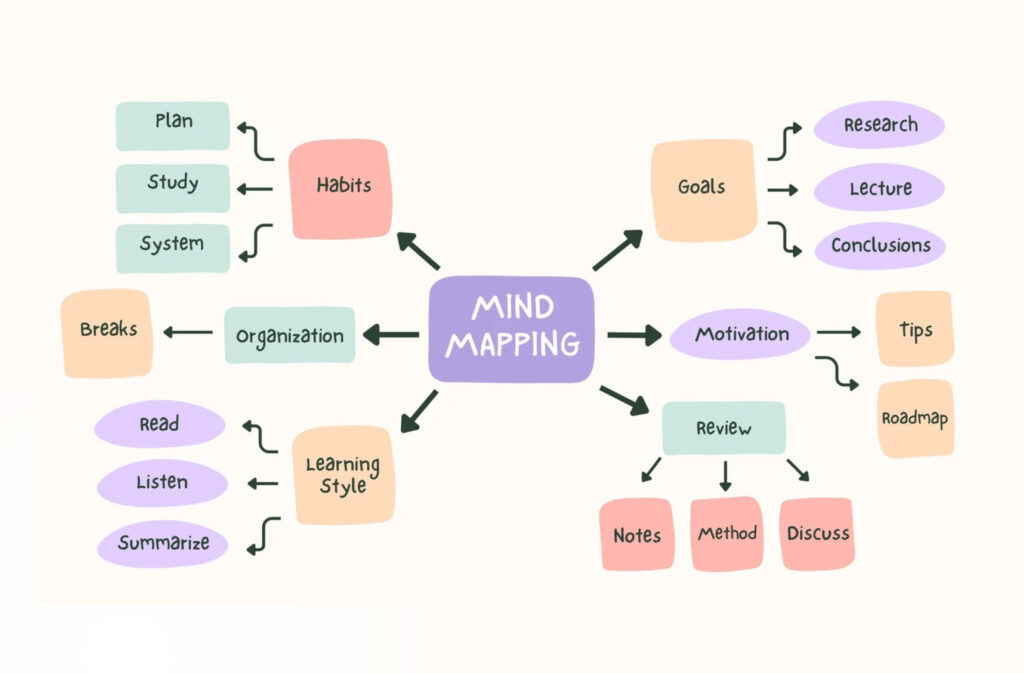



For centuries, students and professionals recorded information the same way. You started at the top-left corner of a page and wrote line after line until you reached the bottom-right. Linear note-taking was the unchallenged default in classrooms, boardrooms, and libraries worldwide.
The brain doesn’t work that way. Neuroscience shows it thinks in webs of association, linking ideas across multiple directions at once. A single concept triggers connections to dozens of related concepts simultaneously. Linear notes fight that architecture instead of mirroring it, which is why you can study for hours and still struggle to recall what you read.
Tony Buzan saw the mismatch. In 1974, he introduced the mind map—a radial diagram built from a central topic, branching outward with keywords, colors, and images—and changed how millions of people brainstorm, study, and plan.
This blog traces the origin of the mind map, the science behind it, and how modern AI tools carry Buzan’s method forward.
The Problem Buzan Saw in Traditional Note-Taking
Tony Buzan was a psychology, English, and mathematics student at the University of British Columbia in 1964 when he hit a wall. The more notes he took, the less he retained. He described the experience as a law of diminishing returns: increasing his study time produced less and less progress, not more.
He walked into the university library and asked for a book on how to use his brain. The librarian pointed him to the medical section. His reply: he didn’t want to operate on his brain; he wanted a user manual. No such book existed.
That gap became his life’s work. Buzan studied how the ancient Greeks used color and spatial memory (the locus technique), how Leonardo da Vinci filled notebooks with non-linear sketches and associations, and how cognitive scientists were beginning to describe the brain as a network of radiating connections rather than a filing cabinet of sequential lists. He realized the problem wasn’t his intelligence. The problem was the format. Linear notes forced a networked brain into a single-lane highway.
Buzan’s 7 Rules That Defined the Mind Map Format
Buzan didn’t just sketch a new kind of diagram. He codified a specific set of rules, published in his 1974 BBC series Use Your Head and later expanded in The Mind Map Book (1993). These rules separated mind mapping from informal doodling and gave the method its structure:
- Start from the center of the page. The main topic sits in the middle, not the top-left corner. This mirrors how the brain radiates outward from a core idea.
- Use a central image or word. Buzan recommended a colorful image with at least three colors as the anchor. An image engages more cortical areas than a plain word.
- Draw curved branches, not straight lines. Curves create stronger visual connections and are more natural to the eye. Straight lines bore the brain, Buzan argued.
- Write one keyword per branch. A single word acts as a trigger for dozens of new associations. A full sentence is a finished thought that closes off further connections.
- Use color—one per main branch. Color separates categories at a glance and activates the right hemisphere, which processes color while the left processes words.
- Add images and icons throughout. The brain processes images 60,000 times faster than text. Buzan estimated that a mind map with ten images carries 10,000 words of information.
- Keep the hierarchy visible. The main branches are thick and close to the center. Sub-branches get thinner as they radiate outward. This visual weight signals importance.
These rules turned an informal sketch into a repeatable method. They’re why Buzan’s mind maps look different from generic spider diagrams and concept maps.
Visual Diagrams Before Buzan—A Longer History Than You Think
Buzan formalized mind mapping, but he didn’t invent visual thinking from scratch. Humans have used branching diagrams to organize knowledge for nearly two millennia.
The earliest known example dates to around 300 AD. Porphyry of Tyros, a Greek philosopher, created the “Tree of Porphyry”—a branching diagram that classified Aristotle’s categories of substance into genera and species. It’s the oldest surviving visual hierarchy in Western philosophy. The Nielsen Norman Group traces the lineage of modern cognitive maps back to these early classification trees.
Ramon Llull, a 13th-century philosopher, used similar tree structures to map logical relationships. Leonardo da Vinci filled his notebooks with non-linear sketches, annotations, and visual cross-references. Albert Einstein used spatial diagrams alongside his equations.
In 1972, Joseph Novak at Cornell University introduced concept maps—a related but distinct format that connects multiple ideas with labeled relationships. Concept maps are more free-form; mind maps follow Buzan’s radial, single-center hierarchy.
What Buzan added wasn’t the idea of visual thinking. It was a codified system: one central image, curved branches, single keywords, colors, and images. He turned centuries of informal practice into a teachable, repeatable method that anyone could learn in minutes.
The Science Behind Why Mind Maps Work
Mind maps aren’t just a preference. Research backs their effect on retention and comprehension.
A study cited by Ness Labs found that mind maps increase memory retention by 10–15% compared to self-chosen study methods. The “mind mappers” performed better on both immediate recall and long-term memory tests, even though they reported lower motivation (choosing your own method feels more comfortable, even when it’s less effective).
The underlying mechanism is dual coding. Your brain encodes information through two channels: verbal (words) and visual (images, spatial layout, color). A mind map activates both channels simultaneously. Linear notes rely on the verbal channel alone. When you color-code a branch, sketch an icon, and position a keyword spatially on the page, you’re creating multiple retrieval paths to the same piece of information.
Mind mapping expert Chuck Frey found that business users report a 25% productivity boost from mind mapping. A 2025 meta-analysis covering 52 randomized controlled studies in medical education found significantly higher exam scores in groups that used mind maps compared to lecture-based learning—across theoretical knowledge, case analysis, and procedural skills.
The takeaway: visual structure isn’t a gimmick. It’s how the brain prefers to receive, store, and recall complex information.
From Pen-and-Paper to AI—How Digital Tools Carry Buzan’s Method Forward
Buzan championed pen-and-paper mind maps for decades, but he recognized early that digital tools could extend the method. In 2006, he launched iMindMap with Welsh entrepreneur Chris Griffiths—the first software designed to replicate the organic, curved-branch style of hand-drawn maps. Digital mind maps added four capabilities that paper couldn’t match:
- Ease of editing—rearranging branches without erasing and redrawing
- Multimedia—embedding images, links, and video inside nodes
- Real-time collaboration—multiple people editing the same map from different locations
- Portability—accessing maps from any device, anywhere
The 2026 landscape goes further. AI-powered mind map generators skip the blank-canvas problem entirely. You describe a topic in plain text, and the AI builds a structured visual hierarchy in seconds—identifying main themes, grouping subtopics, and arranging everything into a radial layout.
Visily’s Diagram AI is one example of this shift.
You type a prompt like “create a mind map for a mobile app redesign,” and the AI generates an editable diagram on the same canvas where you build wireframes, mockups, and prototypes. The mind map doesn’t stay a static brainstorm. You can convert branches into wireframes using text-to-design, add interactivity with auto-prototyping, and hand finished screens to developers through the Figma plugin.
Buzan’s core insight stays the same: the brain thinks in webs, so your notes should too. AI just removes the manual effort of drawing the web. Tools like Visily also add brainstorming templates for SWOT analysis, user journey maps, and product roadmaps—pre-built structures that Buzan would have recognized as Basic Ordering Ideas (the framework his brother Barry introduced to give mind maps clearer starting categories).
How to Create Your First Mind Map
Buzan’s method works whether you’re using a napkin or an AI tool. Here’s the compressed version:
- Place one central topic in the middle of your canvas—a word, phrase, or image that anchors the entire map.
- Draw 3–5 main branches outward, each labeled with a single keyword representing a primary category.
- Add sub-branches to each main branch for supporting details, keeping labels to 1–3 words.
- Color-code each main branch with a distinct color so categories stand out visually.
- Review the map after a break—fresh eyes catch missing connections and redundant branches.
If you want AI to handle the structure, open Visily’s Diagram AI, type your topic in plain text, and edit the generated map on a drag-and-drop canvas. You’ll go from idea to structured diagram in under a minute.
Buzan’s insight was simple: the brain thinks in webs, not lines, and note-taking should match. That idea, formalized in 1974 with curved branches, single keywords, and vivid colors, changed how millions of people organize their thinking. Visily’s AI design tools carry that insight into 2026, generating mind maps from text prompts and converting them into wireframes and clickable prototypes on the same canvas.
Sign up for Visily’s free plan and create your first AI-generated mind map today.