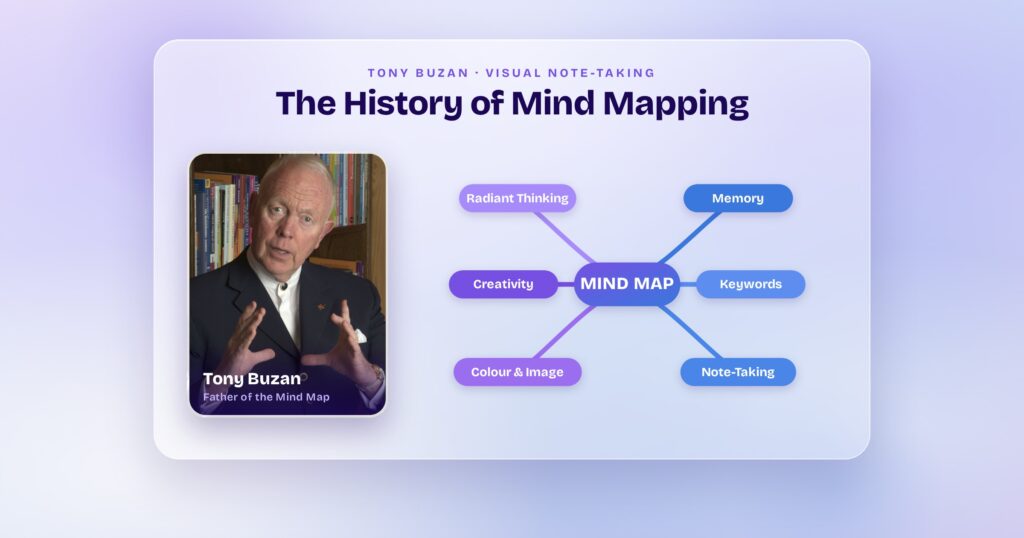



A mind map is a visual diagram that organizes information around one central topic, with related ideas branching outward in a radial hierarchy. It uses keywords instead of sentences, branches instead of lists, and association instead of sequence. Tony Buzan formalized the method in 1974 based on a simple observation: the brain doesn’t think in numbered lists. It thinks in webs.
This article covers how mind maps work, the nine common types, how to build one in seven steps, and how digital tools turn a brainstorm into something your team can ship.
How Does a Mind Map Work?
Every mind map starts the same way: one idea in the center of the page. That central node is the anchor. Everything else grows from it.
Primary branches extend outward from the center, each representing a main theme. Those branches split into sub-branches for supporting details. A product manager mapping a mobile app redesign might place “App Redesign” in the center, with primary branches for “Navigation,””Onboarding,””Dashboard,” and “Settings.” Under “Onboarding,” sub-branches could include “Welcome screen,””Permissions,” and “Tutorial flow.”
The structure mirrors what Buzan called “radiant thinking.” Your brain processes information by association, not in straight lines. When you think about a product launch, your mind doesn’t produce a numbered list. It jumps between marketing, engineering, timeline, budget, and user feedback. A mind map captures that jumping and makes it visible.
That’s why mind maps outperform linear brainstorming lists: they let ideas arrive in any order and still find their place in the structure. Every participant in a brainstorming session can see how their contribution connects to the central goal.
Two structural rules keep mind maps functional. First, each branch carries a single keyword, not a phrase or sentence. A single word acts as a trigger that can lead to dozens of new associations. A sentence closes the thought. Second, limit yourself to about seven first-level branches. That constraint is a forcing function that makes you prioritize.
The colors aren’t decorative. They’re categorical. Each primary branch gets its own color, creating visual grouping that makes the map scannable at a glance. Images serve a similar purpose: they’re mnemonic, not artistic.
A traditional outline forces ideas into a top-to-bottom sequence. A mind map lets them radiate outward. An outline is linear. A mind map is spatial. That difference changes the kind of thinking each format produces.
Types of Mind Maps
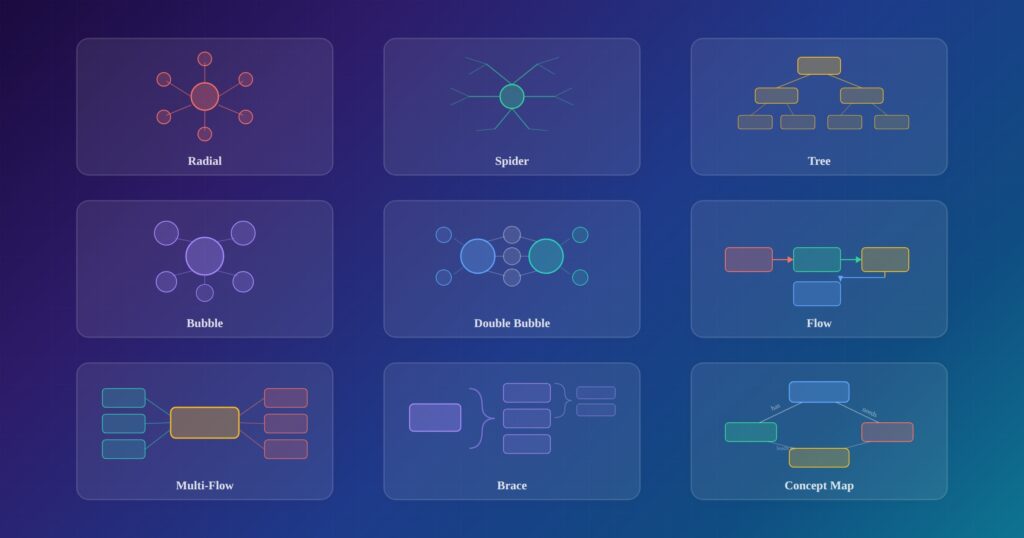
The classic Buzan-style radial diagram is the most recognized mind map, but it’s one of at least nine common types. Each is built for a different kind of thinking. The type you choose depends on whether you’re brainstorming, comparing, planning, or analyzing.
Radial Mind Map
The classic. Central topic in the middle, primary branches radiating outward, sub-branches splitting off each one. This is the Buzan original, and it works best for open-ended brainstorming, product ideation, and meeting agendas.
A product manager mapping everything related to a new feature starts here: user needs on one branch, technical constraints on another, business goals on a third, competitive gaps on a fourth.
Spider Map
Similar to a radial map but flatter. Branches extend outward like spider legs with equal emphasis on each. No deep sub-branching.
This type works for quick idea capture where you don’t yet know which branch matters most. A founder brainstorming revenue models (subscription, freemium, marketplace, licensing) uses a spider map because each option needs equal weight before evaluation.
Tree Map
Hierarchical, running top-down or left-to-right. The main topic sits at the root, and branches represent increasingly specific subtopics.
This type works for organizing research, structuring documentation, and mapping information architecture. A developer mapping an app’s navigation structure uses a tree map: each top-level screen branches into its child screens and data requirements. It’s also useful for a writing project: central thesis branches into chapters, chapters into sections, sections into key arguments.
Bubble Map
A central bubble surrounded by satellite bubbles, each containing an adjective or attribute that describes the central concept. No hierarchy, just association.
A business analyst defining the attributes of a target user persona (“budget-conscious,””mobile-first,””time-poor,””non-technical”) uses a bubble map before building a journey map.
Double Bubble Map
Two bubble maps side by side with shared bubbles in the middle showing commonalities.
A PM comparing two competing feature proposals places shared benefits in the center and unique advantages on each side. It’s also useful for competitive analysis: your product on the left, a competitor on the right, overlapping strengths in the middle.
Flow Map
Sequential, left-to-right or top-to-bottom. Shows the order of steps in a process.
A developer mapping a user’s path from signup to first value uses a flow map: each node is a step, each arrow is a transition. It also works for structuring a presentation, with each node representing a section and the sequence representing the narrative arc.
Multi-Flow Map
Central event with causes on the left and effects on the right.
A product team analyzing why a feature launch underperformed places the event in the center, causes on one side (delayed QA, unclear messaging, wrong audience segment), and effects on the other (low adoption, support ticket spike, churn increase).
Brace Map
Shows part-to-whole relationships using curly braces. The whole is on the left; its component parts branch rightward.
A developer decomposing a software system into its modules (frontend, backend, database, API layer) uses a brace map, with each module’s components nested inside.
Concept Map
Multiple topics connected by labeled relationships. No single center required. Cross-links between nodes show how separate ideas relate.
A business analyst mapping how user roles, permissions, data flows, and compliance requirements interact across a system uses a concept map. Unlike a radial mind map, a concept map can have several centers connected by labeled lines that describe the relationship (“requires,””depends on,””conflicts with”).
The type you pick shapes the thinking you do. Most real projects use several types at different stages.
A Brief History of Mind Maps
Tony Buzan didn’t set out to invent a diagramming technique. He was a student at the University of British Columbia in the 1960s, drowning in linear notes that wouldn’t stick. He studied psychology, English, mathematics, and science, and noticed something about his own brain: it didn’t process information in the top-to-bottom sequence his notebooks demanded. It jumped between ideas, made lateral connections, and lost interest in anything that looked like a numbered list.
So he built a system that matched how his brain actually worked. He drew from cognitive science research and mnemonic techniques, and built a radial diagram with a central image, colored branches, and single keywords on each line.
Buzan brought the method to a mass audience in 1974 through a BBC TV series called Use Your Head. The companion book was translated into over 30 languages and sold more than a million copies across 100 countries. By 2003, his five BBC-related books had sold over 3 million copies combined. He went on to author or co-author more than 80 books, and in 2006, with Welsh entrepreneur Chris Griffiths, he launched iMindMap, the first software designed specifically around his mind mapping rules.
Visual diagramming itself predates Buzan by centuries. Porphyry of Tyros, a 3rd-century Greek philosopher, created the “Porphyrian tree” around 268 CE, a branching diagram that classified Aristotle’s categories of substance into genera and species. Philosopher Ramon Llull (1235-1315) used similar techniques. Leonardo da Vinci and Albert Einstein both used non-linear note-taking methods that included drawings and connections.
What Buzan added was a specific set of rules: one central image, curved branches (not straight lines), single keywords, colors, and images. He formalized what had been an informal practice for centuries. Today, most mind mapping happens in browser-based digital tools with built-in templates and AI-powered generation.
Mind Map vs. Concept Map vs. Flowchart
People confuse these three formats constantly, and the confusion matters because each one produces a different kind of thinking.
Mind map vs. concept map. A mind map radiates from a single central topic in a hierarchical tree structure. A concept map connects multiple topics with labeled relationships and cross-links, without requiring a single center.
The practical difference: mind maps generate and organize ideas around one subject. Concept maps show how separate subjects connect to each other. A product manager brainstorming features for a new app uses a mind map. A business analyst mapping how user roles, permissions, and data flows interact across a system uses a concept map. Concept maps also carry text labels on the links between nodes (“requires,””triggers,””blocks”), which mind maps typically don’t.
Mind map vs. flowchart. Flowcharts show sequence. Step 1 leads to step 2, with decision points along the way. Mind maps show association. Idea A connects to idea B, C, and D at the same time, with no implied order.
A developer mapping an onboarding flow uses a flowchart. That same developer brainstorming what the onboarding should include uses a mind map. Most digital tools let you export either format to PDF or PNG for sharing.
Where they overlap. In practice, teams often start with a mind map to brainstorm, then convert the output into a flowchart for execution or a concept map for analysis. The mind map generates the raw material. The other formats structure it for action.
This workflow is where digital tools that support multiple diagram types earn their value: the transition from brainstorm to structured diagram happens inside the same workspace, not across three separate apps.
When to Use a Mind Map
The answer depends on your role and what you’re trying to accomplish. Here are four scenarios where mind maps do real work.
Product Management
Product managers use mind maps as a visual snapshot of where the product stands. The central node is the product or feature. Branches cover customers, use cases, technical constraints, business goals, and competitive gaps.
When the PM reviews the finished map, they can spot the most promising solution and surface dependencies before work begins. The mind map becomes the artifact they share in a kickoff meeting, making scope visible at a glance. A mind map at the start of a project replaces the 45-minute alignment meeting that would otherwise happen three weeks too late.
Startup Founders
Founders use mind maps to think before they pitch. The central node is the product idea. Branches cover target market, revenue model, competitive landscape, MVP scope, and launch timeline.
The mind map isn’t the pitch deck. It’s the thinking that happens before the pitch deck exists. The founder uses it to structure the narrative (central idea, supporting arguments, evidence, anticipated objections), then builds slides from the structure.
Software Developers
Developers use mind maps to break down complex tasks before writing any code. A developer mapping the information architecture of a new feature places the feature name in the center, with branches for each screen, sub-branches for the data each screen displays, and further sub-branches for user actions.
The mind map reveals which screens connect to which, what data each screen needs, and where the edge cases hide. It’s the precursor to a sitemap or a technical spec.
Business Analysts
Business analysts use mind maps for strategic planning and research organization. A BA mapping a process improvement initiative places the current process in the center, with branches for pain points, sub-branches for proposed solutions, and further sub-branches for dependencies and risks.
The BA also uses the mind map to organize research findings before writing a requirements document: the central node is the project, branches are research themes, sub-branches are specific findings and their sources. The mind map makes the entire process visible on one screen, which is something a 12-page requirements document can’t do.
How to Create a Mind Map in 7 Steps
These steps work on paper or in any digital tool. The example below follows a product manager mapping a mobile app redesign.
Step 1: Write your central topic. One word or short phrase in the middle of the page. For this example: “App Redesign.” Don’t overthink it. The central topic is the anchor, not the conclusion.
Step 2: Add primary branches. Start with three to five main themes: “Navigation,””Onboarding,””Dashboard,””Settings,””Notifications.” Each branch extends outward from the center.
Step 3: Break branches into sub-branches. “Onboarding” splits into “Welcome screen,””Permission requests,””Tutorial flow,””Skip option.” Each sub-branch adds one level of detail. Don’t go deeper than three levels yet.
Step 4: Use keywords, not sentences. Each branch should carry one or two words, not a full description. “Welcome screen” is better than “The screen users see when they first open the app.” The keyword opens the thought. The sentence closes it.
Step 5: Add color and images. Assign a different color to each primary branch. “Navigation” is blue, “Onboarding” is green, “Dashboard” is orange. Color creates visual grouping that makes the map scannable. Add icons or small images where they’ll aid recall.
Step 6: Review and reorganize. Move branches, merge duplicates, identify gaps. The first draft captures what’s already in your head. The second draft is where the value lives: you notice that “Notifications” and “Settings” overlap, that “Onboarding” is missing an accessibility branch, that “Dashboard” needs a data source sub-branch you hadn’t considered.
Step 7: Share and collaborate. A mind map on one person’s screen is a personal note. A mind map shared with a team is a planning artifact. Export it to PDF or PNG for a meeting. Open it for real-time co-editing so developers, designers, and product leads can add their own branches.
Browser-based tools with templates are the easiest starting point: no download, no setup, just open and start branching. Most tools also let you export to Figma or markdown for further work.
Three Mind Map Mistakes Worth Fixing
Most mind mapping advice repeats the basics: use colors, add images, start in the center. These three address the mistakes people actually make.
Use one word per branch, not one phrase. This is the most common mistake. People write “user onboarding flow” on a branch when “onboarding” alone would generate more connections. A single word gives the brain more freedom. A sentence is a finished thought. A word is an open door. If you find yourself writing phrases, you’re trying to explain the idea instead of naming it.
Stop at three levels of depth. Most useful mind maps have a central topic, primary branches, and one layer of sub-branches. Going deeper usually means the mind map is trying to be an outline. If you need four levels, you probably need a second mind map with one of your branches as the new center.
Rebuild, don’t just add. The first version of a mind map captures what’s already in your head. The value comes from the second version, when you reorganize branches, notice gaps, and spot connections you missed. A mind map you never reorganize is just a list arranged in a circle. On paper, reorganizing means starting over. In a digital tool, it takes seconds.
When evaluating any mind mapping application, look for tools that make reorganization easy. That single feature separates useful tools from pretty ones.
Can AI Build a Mind Map?
Partially. ChatGPT and similar tools can generate text-based outlines that resemble mind map hierarchies. You can ask for a markdown structure with a central topic, branches, and sub-branches, and the output will be organized and useful. But it’s text, not a diagram. You’d need to copy that output into a separate mind mapping tool and manually convert it.
AI-powered design platforms skip the copy-paste workflow. They take a text prompt and generate a visual diagram directly: editable, shareable, and ready to convert into other formats.
Visily’s Text to Diagram feature, for example, generates flowcharts, sitemaps, and entity relationship diagrams from a plain-language description. The output isn’t a static image. It’s an editable diagram on a canvas where you can drag branches, add nodes, and share with your team.
The honest limitation: AI-generated mind maps are starting points, not finished artifacts. The value of a mind map comes from the reorganization, the second and third pass where you move branches, notice gaps, and spot connections the AI missed. AI gives you the first draft faster. You still do the thinking.
From Brainstorm to Design: Digital Mind Mapping
Most mind maps die on the whiteboard. A product manager creates one during a brainstorming session, takes a photo, and the photo sits in a Slack channel forever. The ideas were good. The connections were visible. But the mind map never became screens, flows, or prototypes.
The gap between “brainstorm” and “build” is where most good ideas stall.
Browser-based design platforms close this gap. They run in the browser (no installation), store everything in the cloud (automatic syncing across devices), and support real-time co-editing, making them the natural choice for remote teams. Desktop tools store files locally and require installation. For teams, browser-based is almost always the better choice.
The best platforms integrate with productivity tools, image libraries, and design software. Visily connects to Pexels, Unsplash, and Pixabay for images, exports to Figma for pixel-level refinement, and connects to 294+ apps through ApiX-Drive for workflow automation.
Its Text to Diagram feature generates flowcharts, sitemaps, and ER diagrams from text prompts. Its Diagram to Design feature converts those diagrams into full UI layouts. The mind map doesn’t dead-end. It becomes the first step in a design workflow.
The platform is built for the people who make mind maps most often: product managers, founders, developers, and business analysts who aren’t trained designers. It requires no design skills, runs in the browser on any device, and has a free tier generous enough to test the full workflow before committing to a paid plan.
When choosing a mind mapping tool for your team, the criteria that matter most are real-time co-editing, cloud storage, browser-based access, commenting and feedback features, and presentation mode for reviews. If the tool also lets you turn diagrams into wireframes and prototypes, you’ve eliminated the gap between brainstorming and building.
How Visily Turns Diagrams into Designs
Here’s what the workflow looks like in practice. A product manager types a description of a user onboarding flow into the Text to Diagram feature. Visily generates a flowchart.
The PM then uses Diagram to Design to convert that flowchart into editable UI screens: a welcome screen, a permissions screen, a tutorial screen. Each screen is a real, editable wireframe with drag-and-drop components.
The PM can switch between low-fidelity wireframes and high-fidelity mockups on the same board without losing work. The platform includes 1,500+ pre-built templates sorted by screen type, flow, or app category.
The collaboration side works the same way. The PM shares the board with their team for real-time co-editing using on-canvas cursor chat and commenting. Developers inspect CSS values for handoff.
As of March 2026, teams can also generate React, Vue, and HTML code directly from their designs. Designers export to Figma for pixel-level refinement. Guest viewers and editors can access the board without a full account.
The PM can present the design in presentation mode for client or team reviews. The mind map that started as a brainstorm is now a clickable prototype, and the PM never opened Figma, Sketch, or Adobe XD.
Mind Map Examples by Role
Abstract advice is easy to ignore. Concrete examples are harder to dismiss. Here are four mind maps you could build today, each tied to a specific role and task.
Product Manager: Feature Prioritization. Central topic: “Q3 Feature Roadmap.” Primary branches: “User Requests,””Technical Debt,””Revenue Impact,””Competitive Gaps.” Sub-branches under “User Requests”: specific feature names pulled from support tickets (“Dark mode,””Bulk export,””SSO integration”).
This mind map becomes the input for a sprint planning session. The PM walks the team through each branch, and the group decides which features move to the backlog based on the visible connections between user demand, revenue potential, and engineering effort.
Startup Founder: MVP Scoping. Central topic: “MVP.” Primary branches: “Core Features,””Target User,””Tech Stack,””Launch Timeline,””Budget.” Sub-branches under “Core Features”: the three features that must ship vs. the six that can wait.
The founder uses this mind map to brief their developer, or to generate wireframes directly in a design tool like Visily. The mind map is thinking. The wireframe is the output.
Software Developer: Information Architecture. Central topic: “App Navigation.” Primary branches: each top-level screen (Home, Profile, Search, Settings, Notifications). Sub-branches: what data each screen displays, what actions users can take, which screens link to which.
This mind map is the precursor to a sitemap. In Visily, it can become one with Text to Diagram, then convert into screen layouts with Diagram to Design.
Business Analyst: Process Mapping. Central topic: “Customer Onboarding Process.” Primary branches: each stage (Application, Verification, Account Setup, First Login, First Value). Sub-branches: pain points at each stage, responsible teams, SLA targets.
The BA uses this to identify bottlenecks before proposing a redesign. The mind map makes the entire process visible on one screen.
Where to Create a Mind Map for Free
Three categories of free tools exist, and the right choice depends on what happens after the mind map.
Dedicated mind mapping apps like Coggle and MindMup do one thing well: mind maps. They’re lightweight, browser-based, and free for basic use. If all you need is a diagram and nothing else, they work.
Whiteboard tools like Miro and FigJam include mind mapping as one feature among many. They’re good for teams that already use those platforms for other work.
AI-powered design platforms generate diagrams from text and convert them into editable UI designs. They’re built for teams that want to go from brainstorm to wireframe to prototype without switching tools.
Most tools use a freemium model: a free tier with limited features, and paid monthly subscriptions that add more boards, AI credits, templates, and collaboration options.
Visily’s Starter plan is free and includes 2 editable boards, 300 AI credits in the first month, 150 template credits per month, and access to the full library of 1,500+ pre-built UI screens. Pro plans start at $14/month per editor and add unlimited boards, 3,000 AI credits, Figma export, and guest editors. Business plans at $29/month include SAML SSO and a dedicated account manager.
If you just learned what a mind map is and wants to try building one, then turning it into a wireframe, Visily is the lowest-friction starting point. Sign up at visily.ai and start mind mapping for free.