Whether you’re brainstorming or working on a project together, Visily provides the perfect tools with our diagram elements and templates. Get started in Visily by either quickly creating diagrams using elements or selecting from a variety of pre-built templates available in the Visily library.
Diagram Elements
Visily provides a rich set of diagram elements to help you brainstorm ideas, map out processes, and design structured systems directly on your boards. Available elements include:
- Sticky notes,
- Elements for building flowcharts, use case diagrams, entity relationship diagrams (ERDs), class diagrams, and
- Other basic elements and smart components support effective diagram visualization.
You can access Diagram Elements from the Diagram Library panel.
Sticky Notes
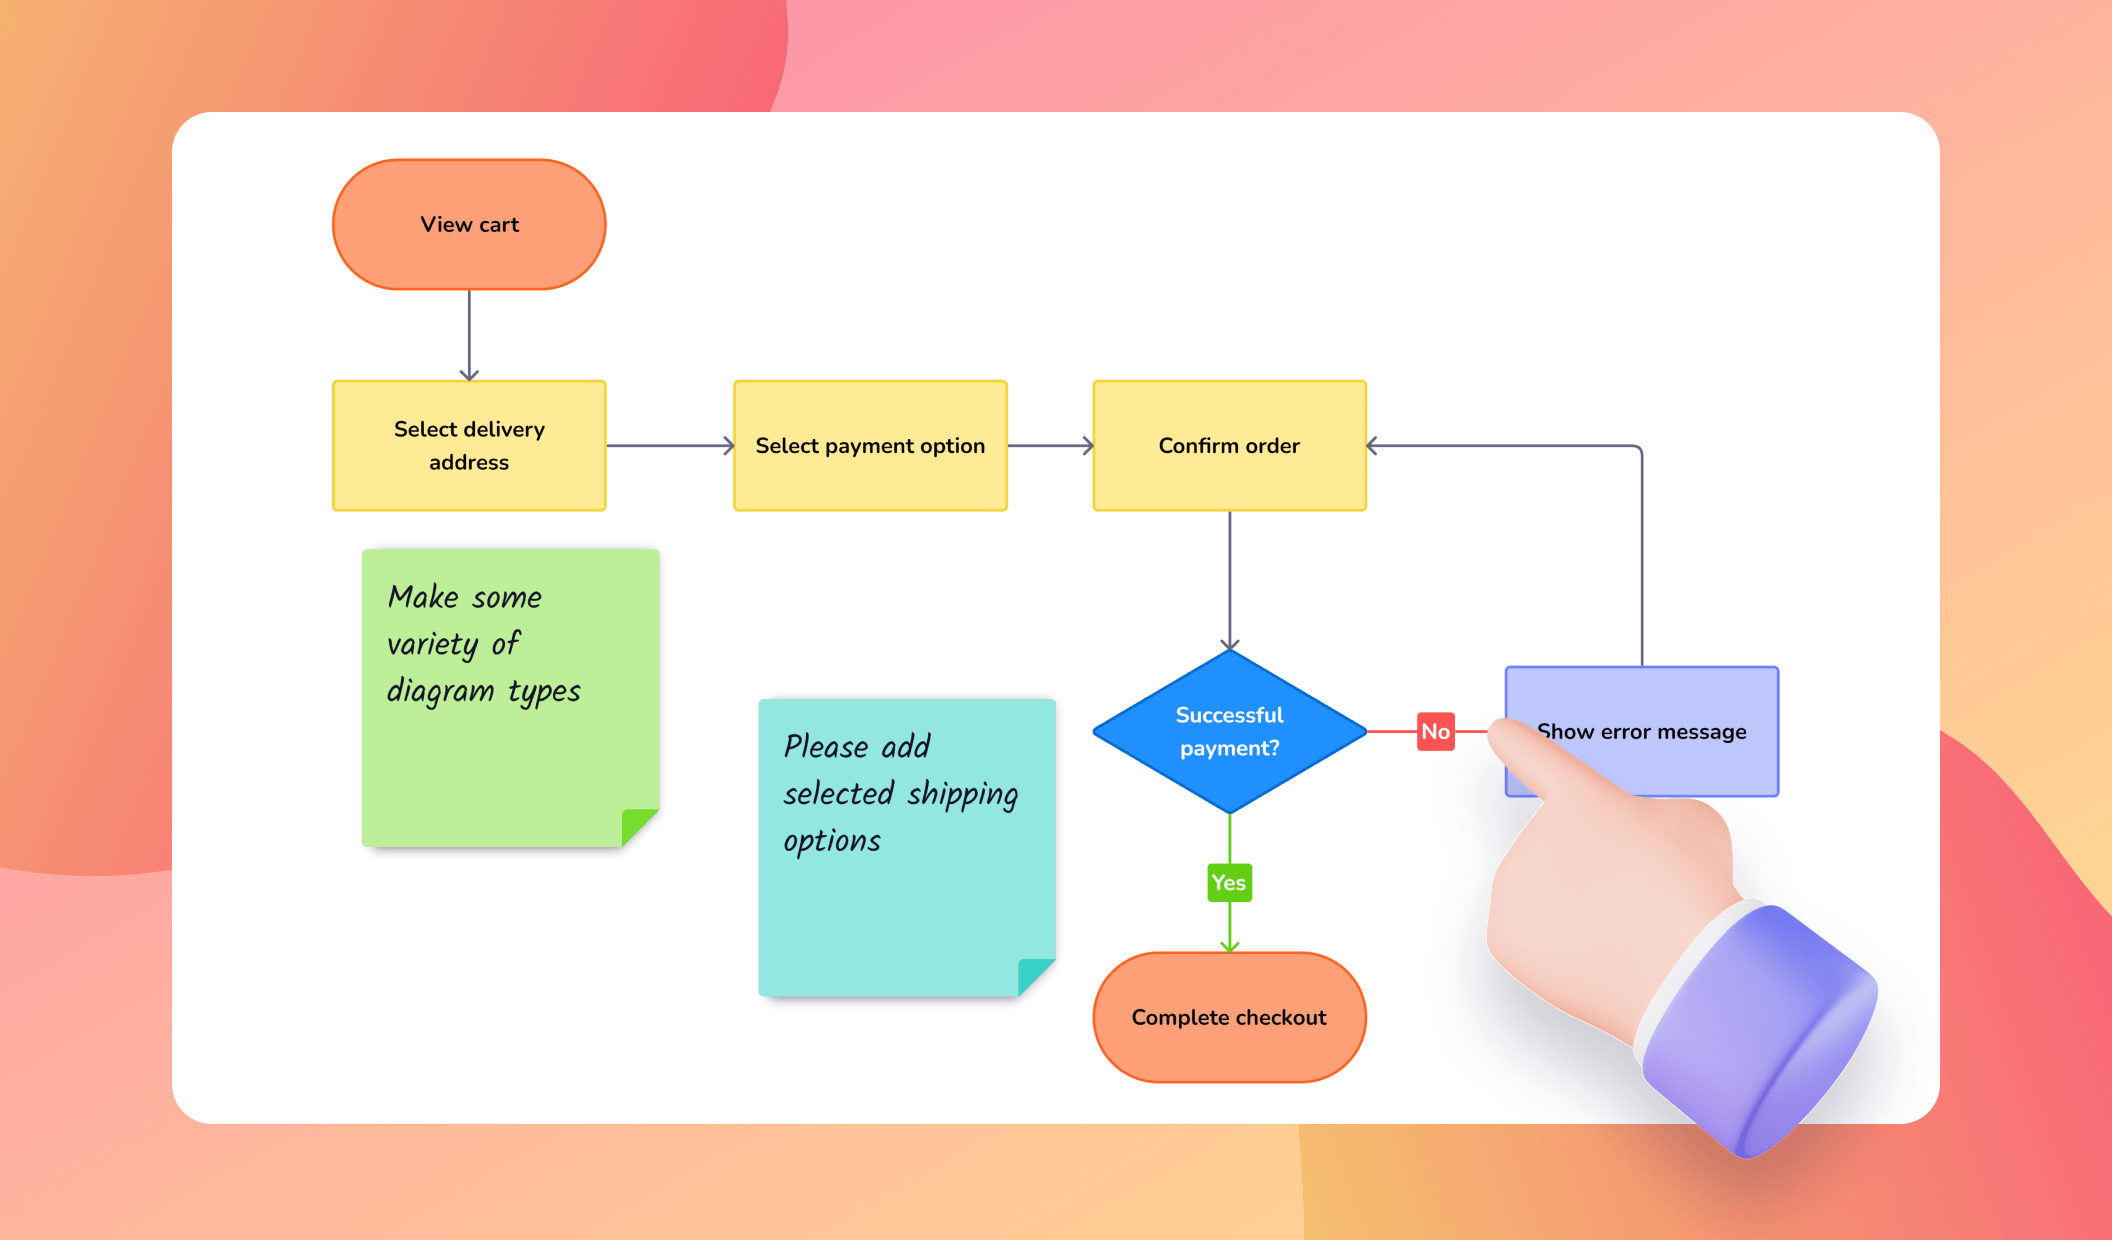
Sticky Notes are a simple yet powerful tool in Visily, perfect for quick brainstorming, annotations, or leaving collaborative notes during your design process.
You can quickly create new sticky notes in either of these ways:
- Click the Sticky Note item in the Sticky Notes section of the Diagram Library panel.
- Hotkey: Press “N” on your keyboard.
- Click the “+” button that appears around an existing sticky note to add a new one in that direction. You can also click & drag the “+” button to create a connector and link sticky notes together.
Once added, sticky notes can be customized to better organize your thoughts and collaborate:
- Change color: assign different colors for grouping or emphasis.
- Text formatting: apply styles, and even create bullet or numbered lists while adding text.
- Hyperlink: add links for quick references.
- Show/Hide Author: toggle author visibility for collaborative notes.
- Resize: adjust the size of your sticky note, including precise control via the Layer Properties panel.
Flowchart Diagram
Visily provides a set of common diagram shapes for building flowcharts, including Start/End, Input/Output, Process, Decision, Connector, Merge, and Extract. These shapes allow you to visually map out processes, decisions, and flows in a clear and structured way.
You can add shapes to your flowchart in several ways:
- From the Diagram library, go to the Flowchart Diagram section and select the shape you want to add and place it on the canvas.
- Click the “+” button that appears around an existing shape to add a new one in that direction. By default, this creates the same type of shape as the original.
- Click & drag the “+” button to create a connector. A shape option pop-up will appear at the end of the connecting arrow, allowing you to choose the type of shape to add.
You can add multiple shapes from an existing shape, even in the same direction, making it easy to expand your flow quickly.
Once added, you can customize shapes to better fit your diagram:
- Style and Shape formatting: Switch between different shape types, and choose styles for the shape, such as filled & outlined, filled & borderless, or transparent & outlined. New shapes added from an existing one inherit the currently applied style.
- Color and Border formatting: Customize shape color, adjust border thickness, and apply dashed or solid styles.
- Text formatting: Add and style text directly inside shapes. Use formatting options, including bullet points and numbered lists, for clearer labeling.
- Hyperlink: Attach links to shapes for quick navigation to references, documents, or external resources.
Use Case Diagram
A use case diagram is a simple yet powerful way to show the relationships between users and the system’s functions or services. This type of diagram is especially useful for capturing requirements, defining system scope, and illustrating user interactions in a clear and structured way.
Visily provides a set of common diagram elements for building Use Case Diagrams, including actors, use cases, system boundaries, and association lines. You can find these elements in the Use Case Diagram section of the Diagram Library panel.
- Use Case: Works like a diagram shape. You can add, resize, and format it with the same options available for other shapes.
- Actor: Similar to other shapes, you can add and format with style, color, and text options. Additionally, actors can be customized by changing their icon and applying flips.
- System Boundary: Represents a group of related use cases, helping define the scope of the system.
- Association Lines: Prebuilt connectors that represent common relationships such as generalization, include, and extend.
Entity Relationship Diagram
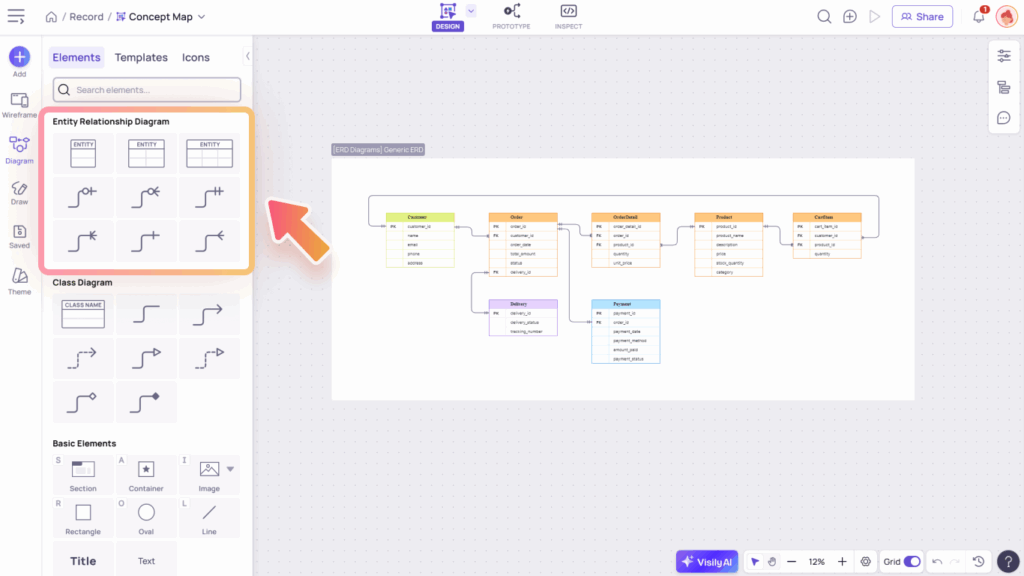
Entity Relationship Diagrams (ERDs) are used to model the structure of a database by illustrating entities (tables), their attributes, and the relationships between them. In Visily, ERD elements help you clearly define objects, their properties, and how they connect.
From the Diagram Library, go to the Entity Relationship Diagram section, where you will find elements such as different types of Entities and Relationships.
- Entity includes three types: Field, Field + Type, and Key + Field + Type. Entities work like tables, allowing you to define and organize data fields. To learn more about editing tables, see the Table Guideline.
- Relationship: Supports different types of connections, including one, many, zero or one, zero or many, one and only one, and one or many.

Class Diagram
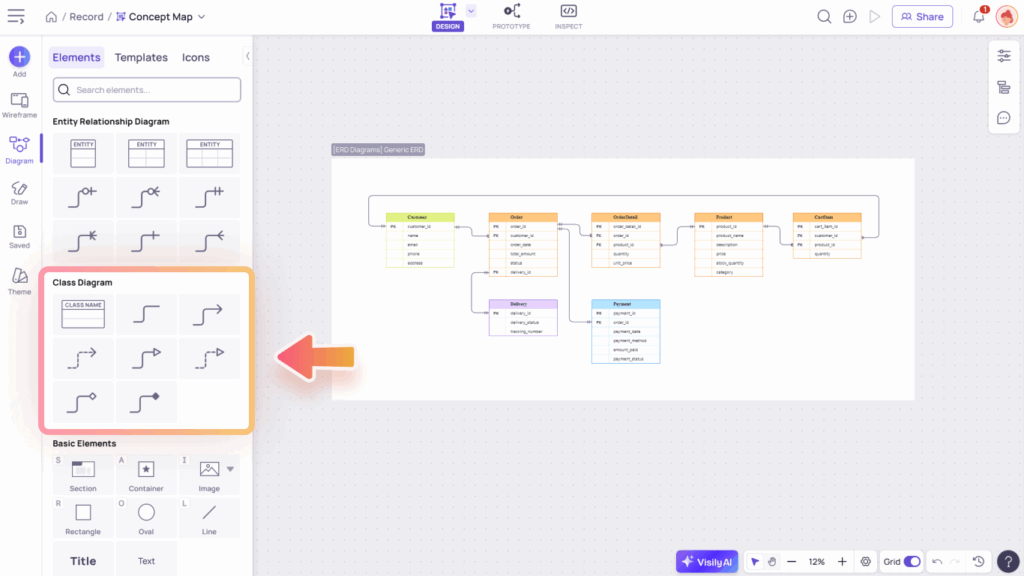
Class Diagrams are used to model the structure of object-oriented systems by illustrating classes, their attributes, methods, and the relationships between them. In Visily, Class Diagram elements help you define objects, their behaviors, and how they interact within a system.
From the Diagram Library, go to the Class Diagram section, where you will find elements of Classes and Relationships.
- Class Table: Similar to entities, a class functions like a table, allowing you to define and organize attributes and methods.
- Relationship: Supports different types of associations commonly used in object-oriented modeling, including inheritance (generalization), realization, aggregation, composition, and dependency.


Connector in Diagram
Connectors are used to link shapes and elements in your diagram, making relationships and flows easy to follow.
In Visily, connectors can be quickly added by clicking or dragging the “+” button around an diagram element, or by using the hotkey “X“to add stand-alone connectors.
When added, you can customize and work with connectors in several ways:
- Connector Type: Switch between elbow, straight, or curve connectors.
- Formatting: Customize connector appearance by adjusting color, thickness, dash style, and adding arrowheads at the line’s start or end.
- Text: Add labels or notes directly onto a connector line for clarity.

In addition to the categorized diagram elements within each diagram type, you can also access basic elements and smart components that support more flexible visualization. These elements help you enhance and customize your diagrams beyond the standard shapes, making them clearer and more effective.
Learn more about basic elements and smart components in our UI Library guide.

Diagram Templates
Diagram Templates in Visily provide a quick starting point for creating structured diagrams without having to build them from scratch. They let you jump straight into brainstorming, planning, or system modeling with a ready-made structure that you can then customize to fit your specific needs.
For easy browsing, diagram templates are organized into three categories: Diagram & Flowchart, Strategy & Planning, and Meetings. You can access them in two ways:
- From the Template Dialog, under the Diagrams tab.
- Directly from the Diagram Library panel, under the Templates tab.
You can preview and add a template directly from its thumbnail, or open it in Preview mode to zoom in for a closer look. From the Preview view, simply click “Use this template” to add it to your board.


